Podcast Analytics
Accessing Podcast Analytics
Tip: Words to know
- Reach: the number of people who are seeing your content
- Platform: A specific site like Facebook or Mail Chimp
- Category: A grouping of Platforms like Podcasts or Social Media
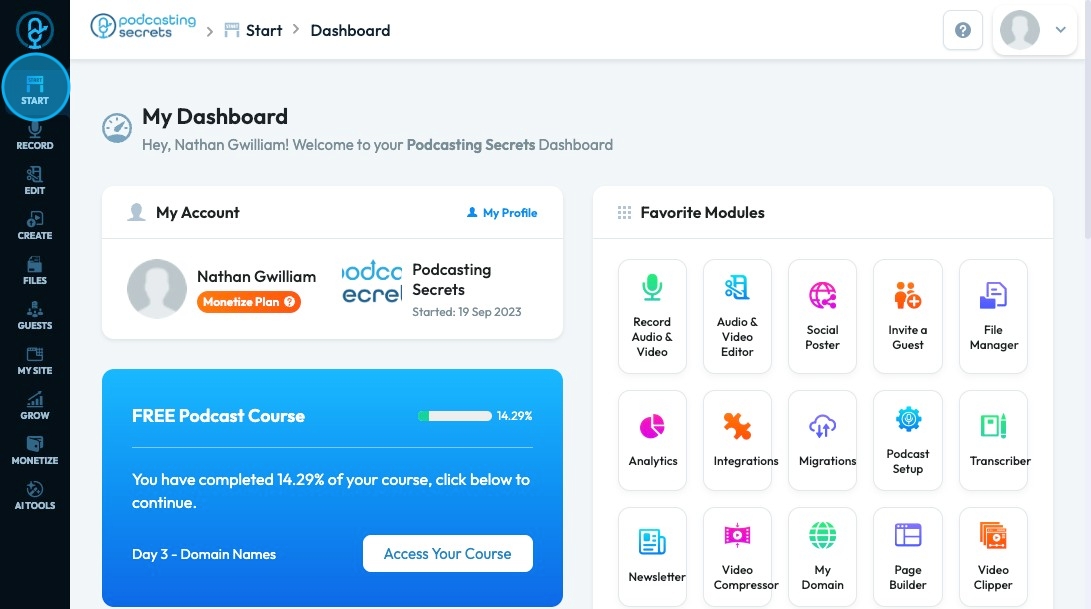
1. Navigate to https://app.podup.com/home
Click Start
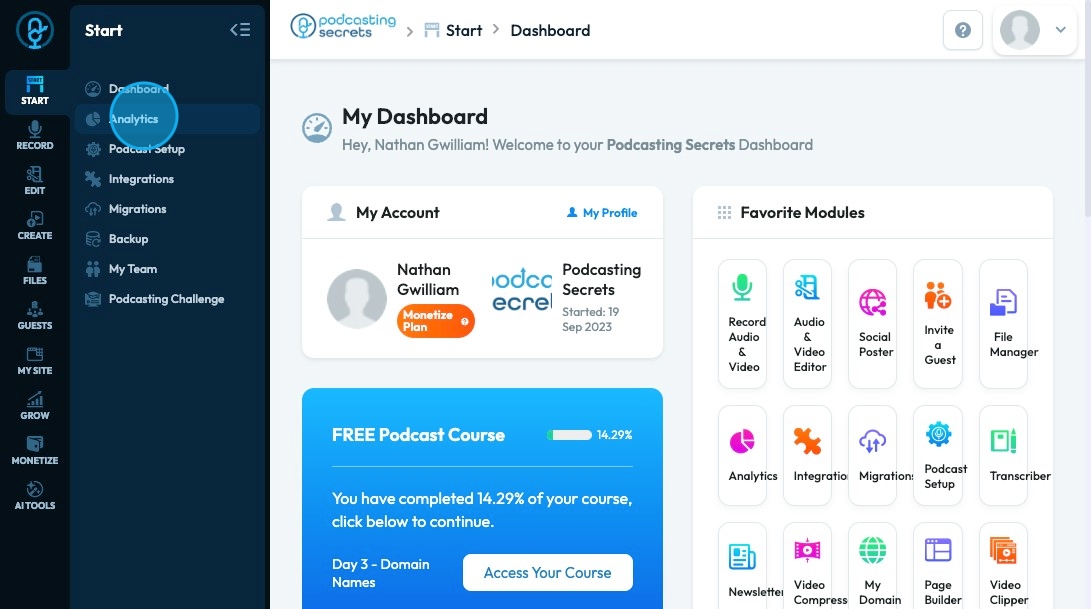
2. Click "Analytics"
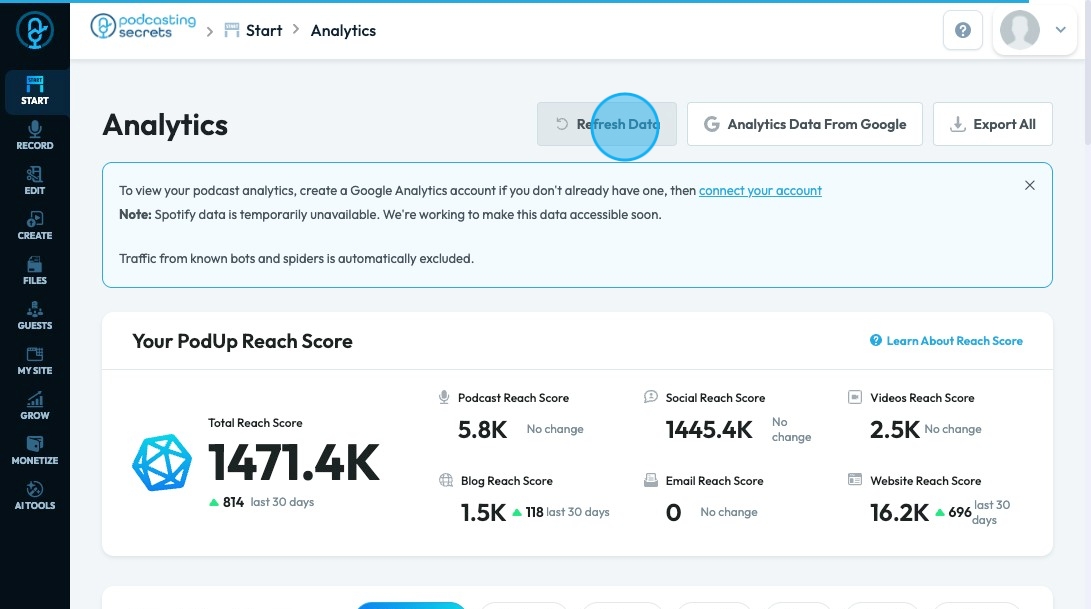
3. The Analytics page will open with a helpful tip for your analytics. Click "Refresh Data" to reload the data
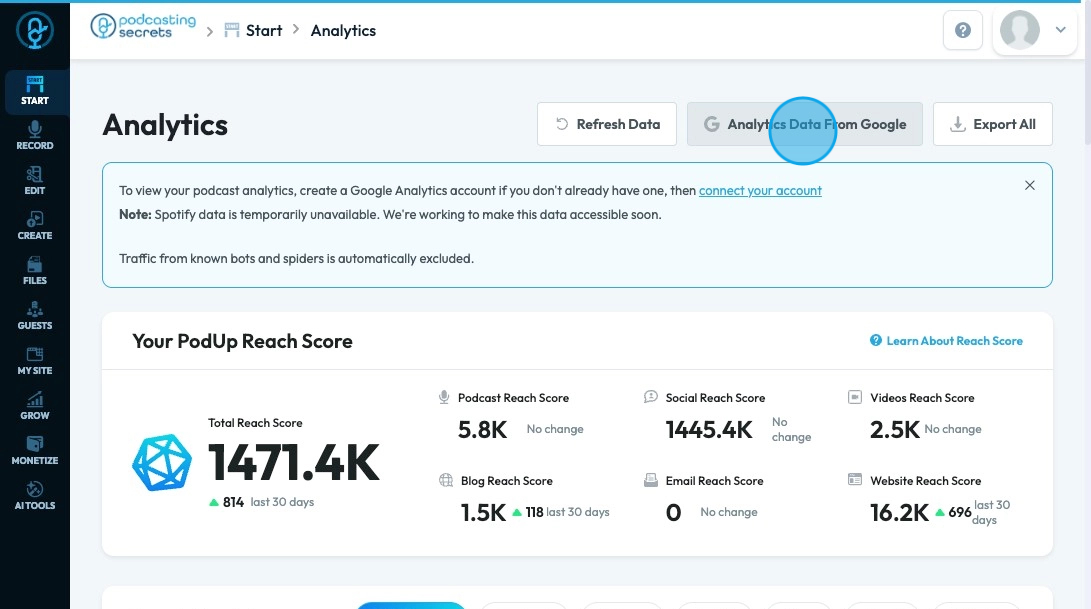
4. Click "Analytics Data From Google" to open a separate page for Google Analytics
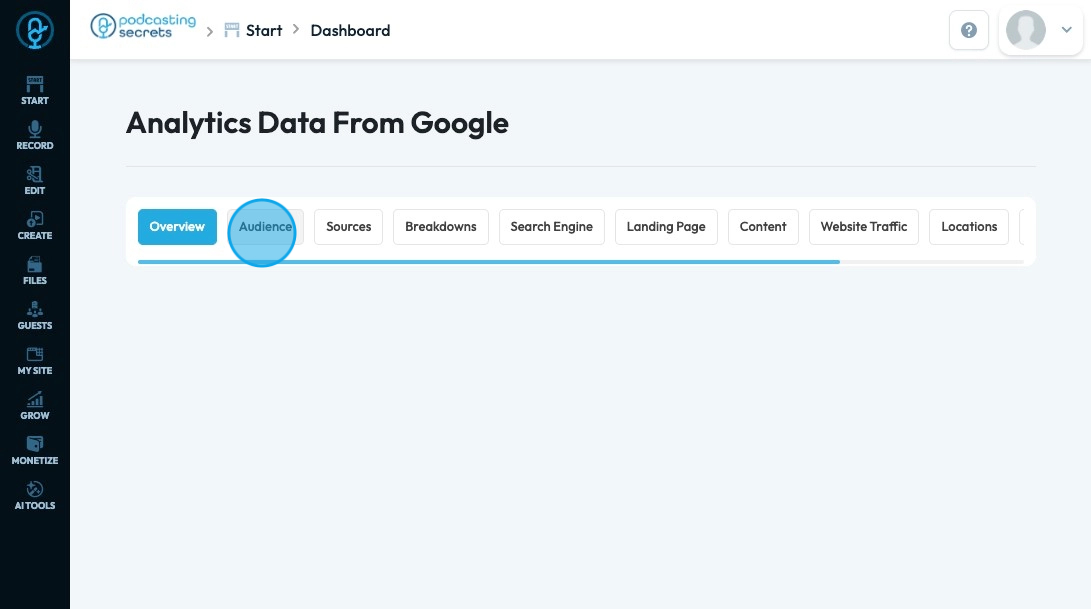
5. Analytics Data From Google Contains the following data
- Overview
- Audience
- Sources
- Breakdowns
- SearchEngine
- Landing Page
- Content
- Website Traffic
- Locations
- Metrics
- Channels
- Events
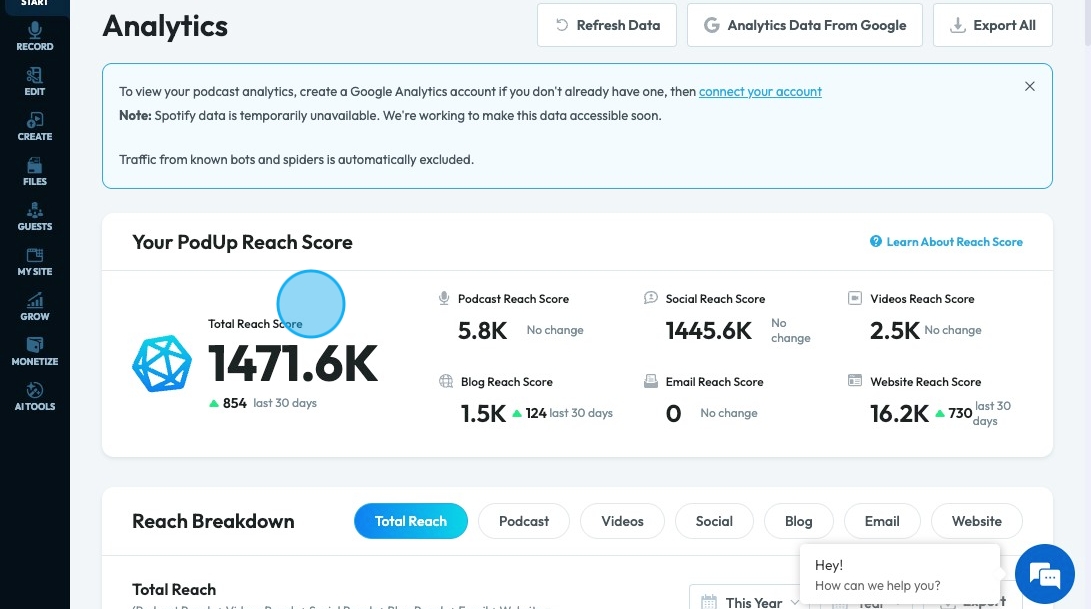
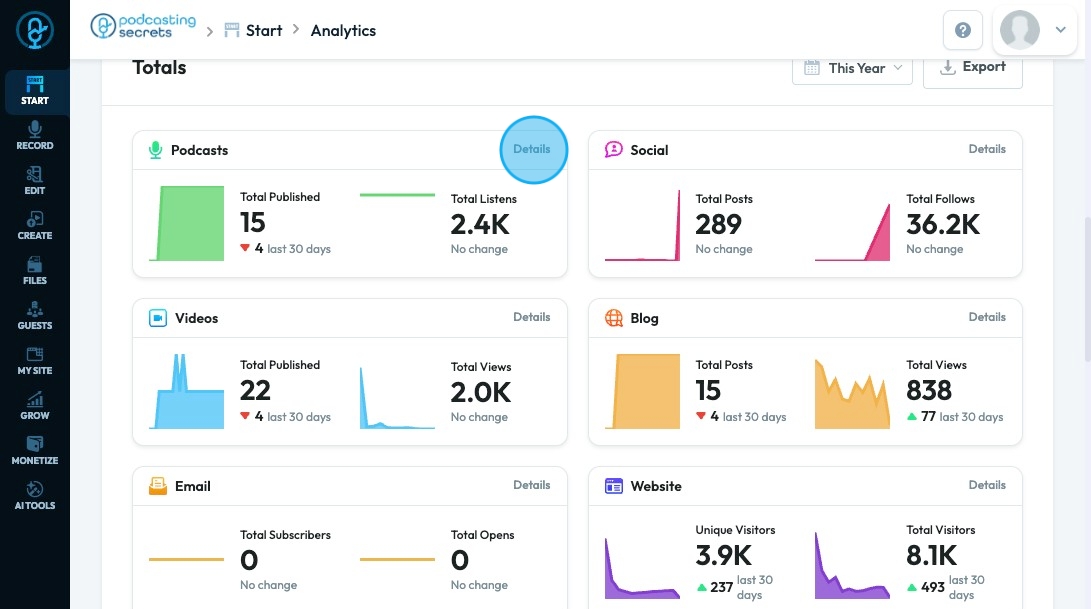
6. Your PodUp reach score displays the number of people that your content is reaching.
- Total Reach Score References the total number of people reached on every platform combined. This reach is broken down into different platforms to the right of the total score
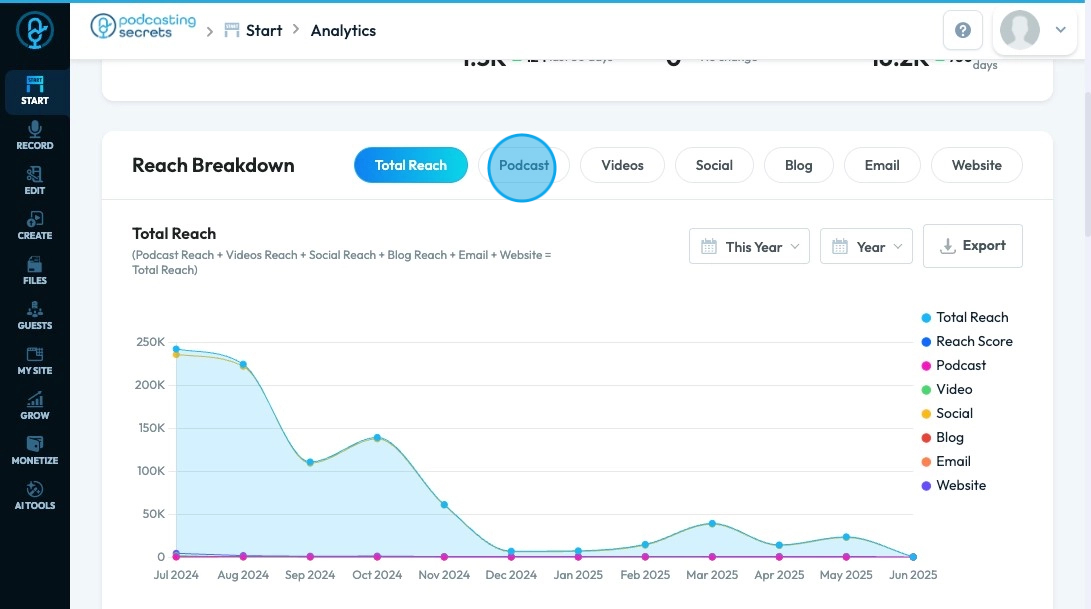
7. "Reach Breakdown" will display a graph of your total reach
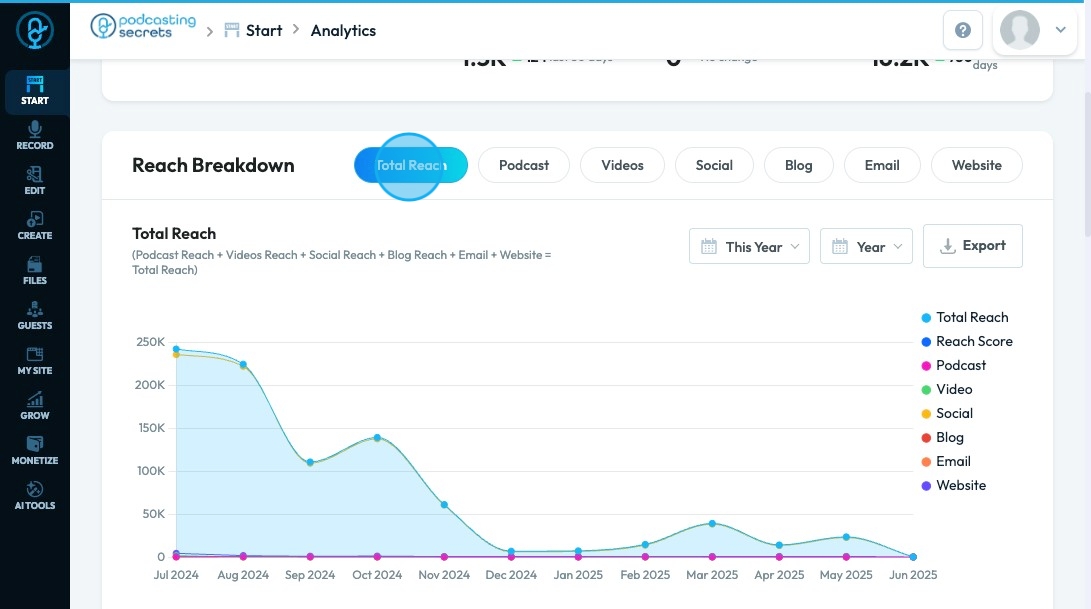
8. The other categories will display the reach of the category specifically
9. Click "This Year" to change the time frame of the graph display
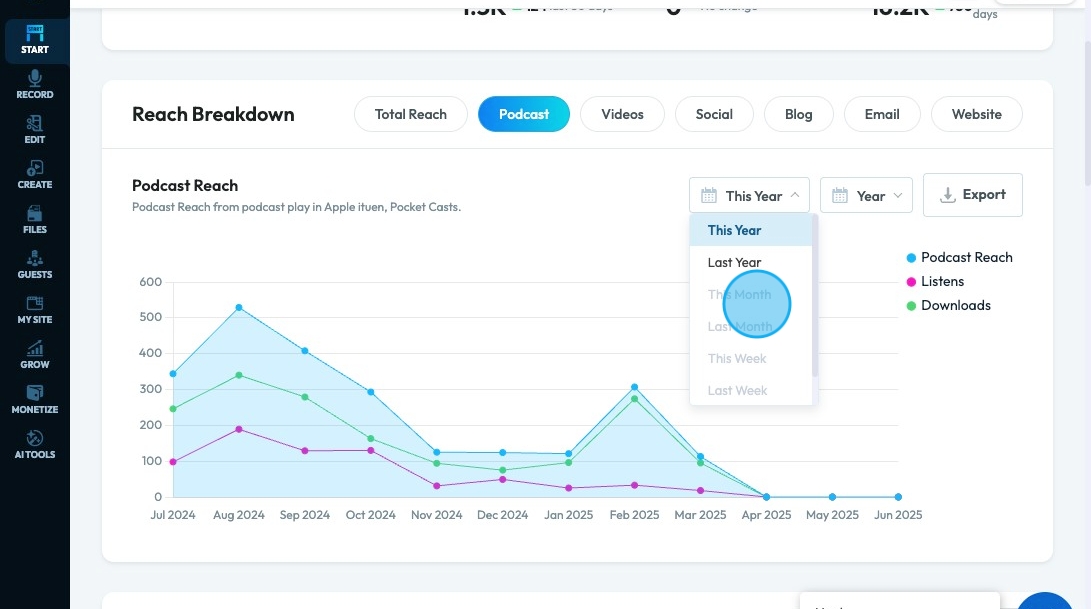
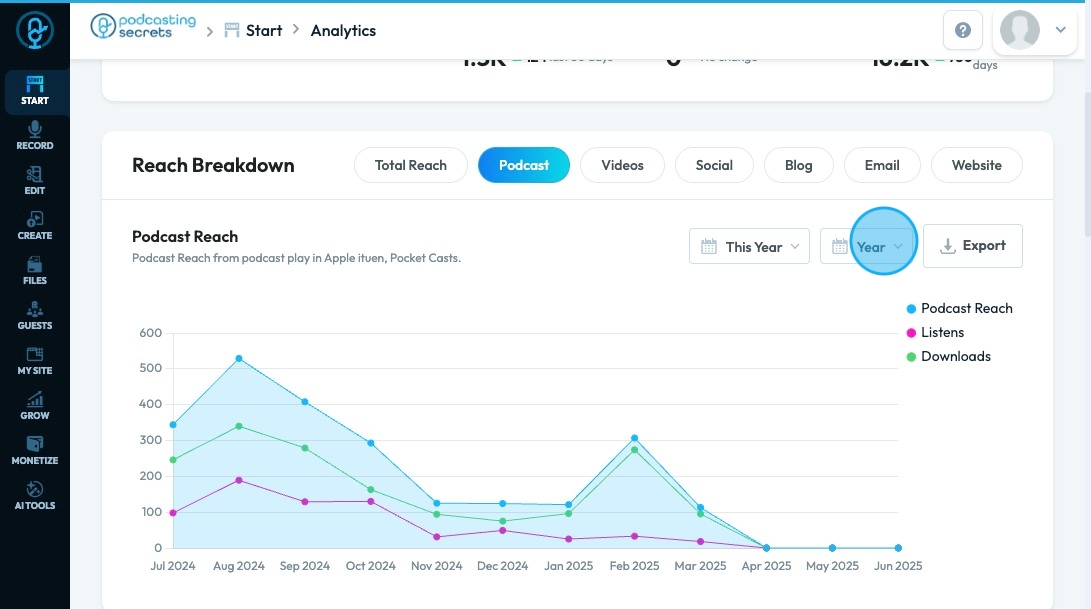
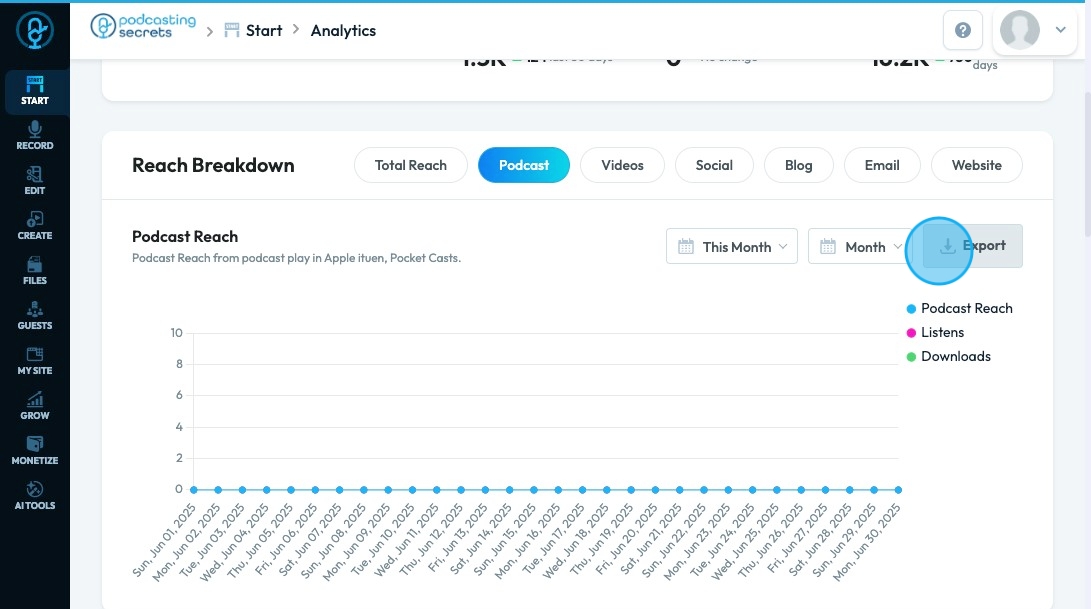
10. Click "Year" to change how detailed the graph is. The smaller the unit (day) the more precise the graph.
11. Click "Export" to download the data from the graph
12. The reach of each individual category is shown below the total reach score, along with the number of publications and the people engaging with them.
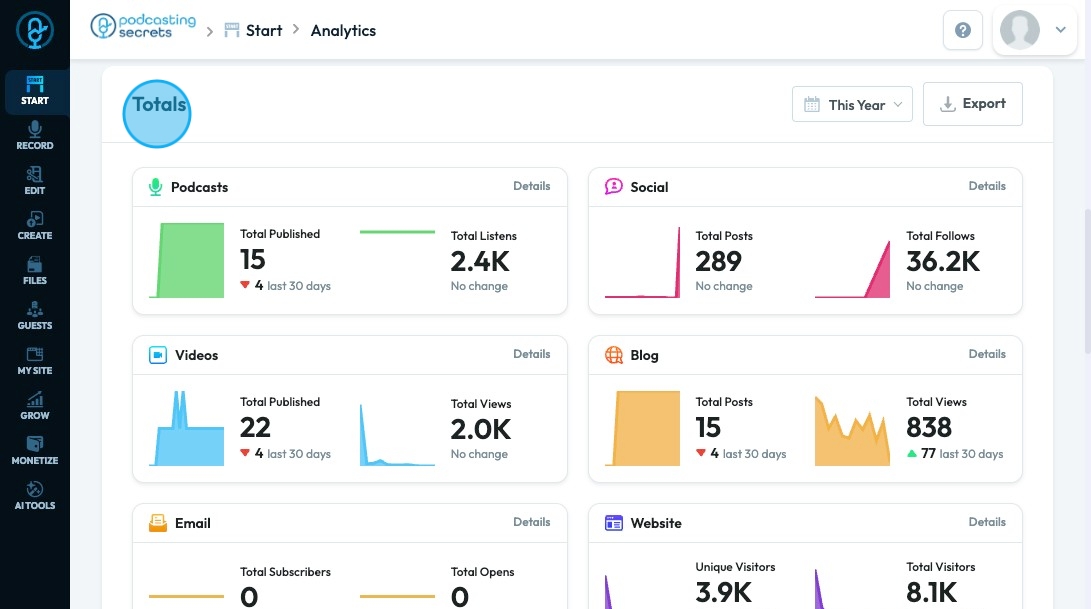
13. "Details" will show more specific data of that particular category
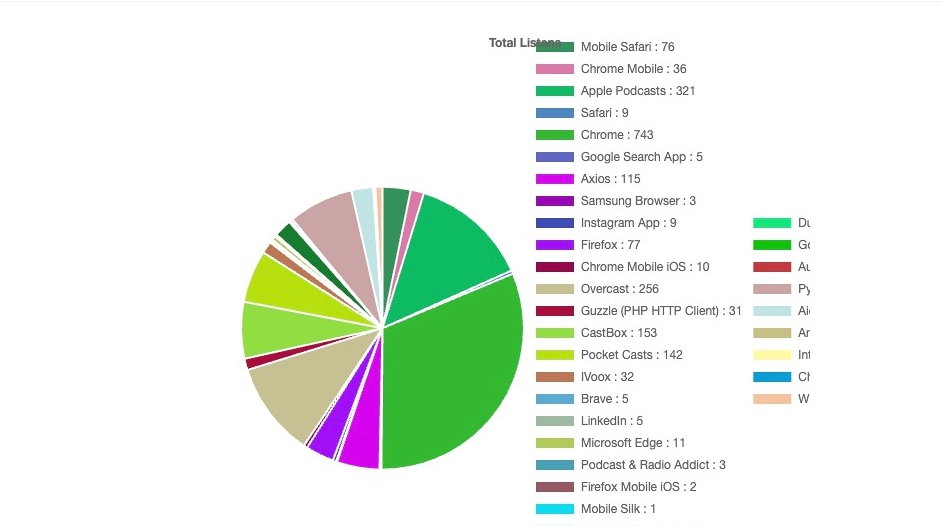
14. A Pie-graph will break down the listens or views per platform so you can identify which platform are the most successful for your podcast
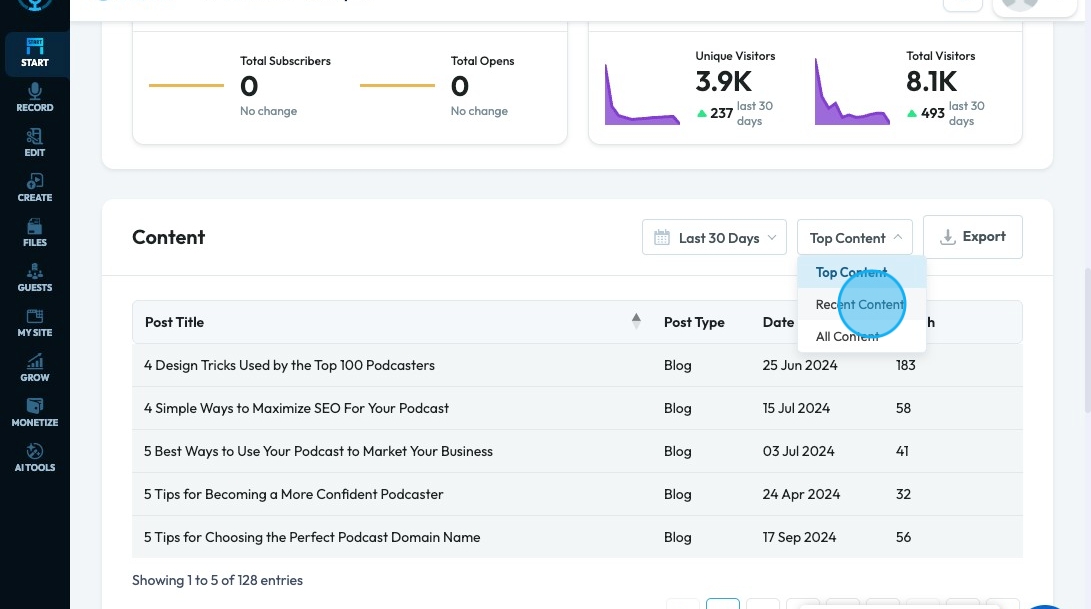
15. Below "Totals", "Content" lists what you have published including the title, post type, and publication date
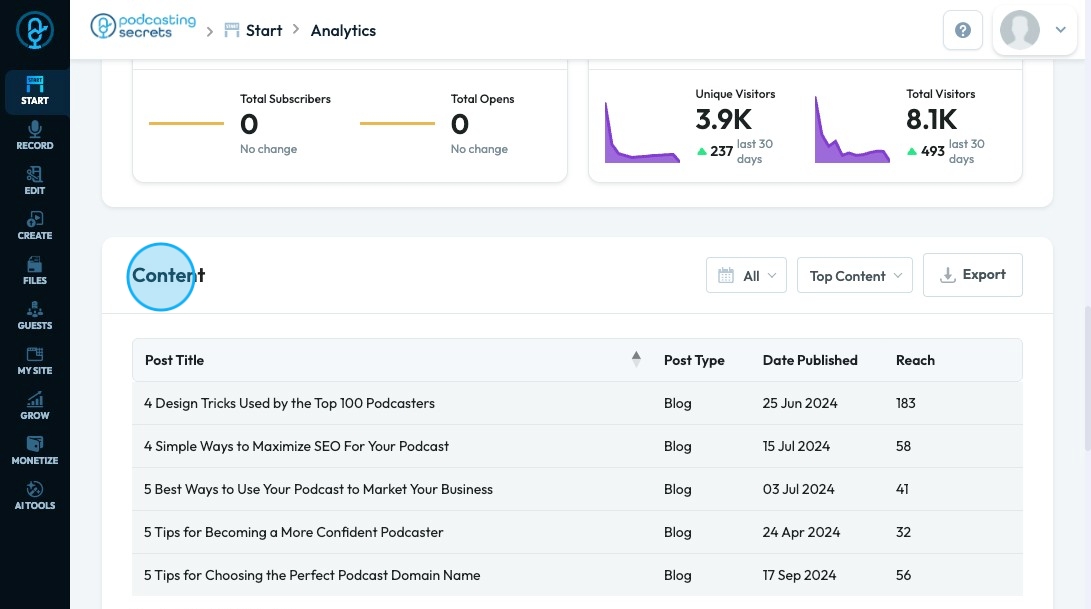
16. Click "All" to filter the content by publication date
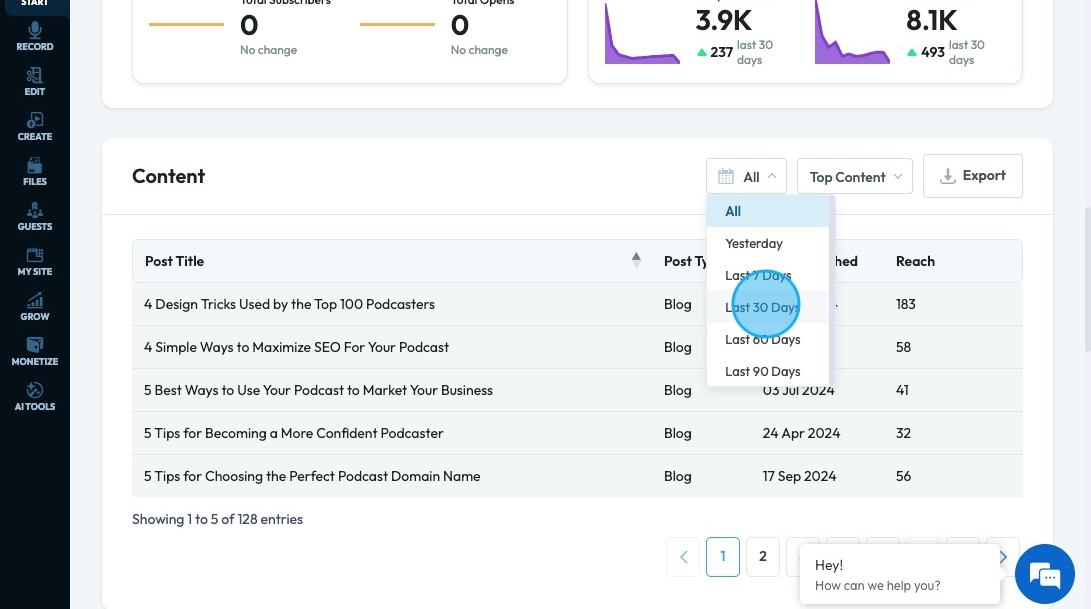
17. Click "All Content" to receive a drop-down menu to change how the content is displayed
- Top Content: Displays the content with the highest reach
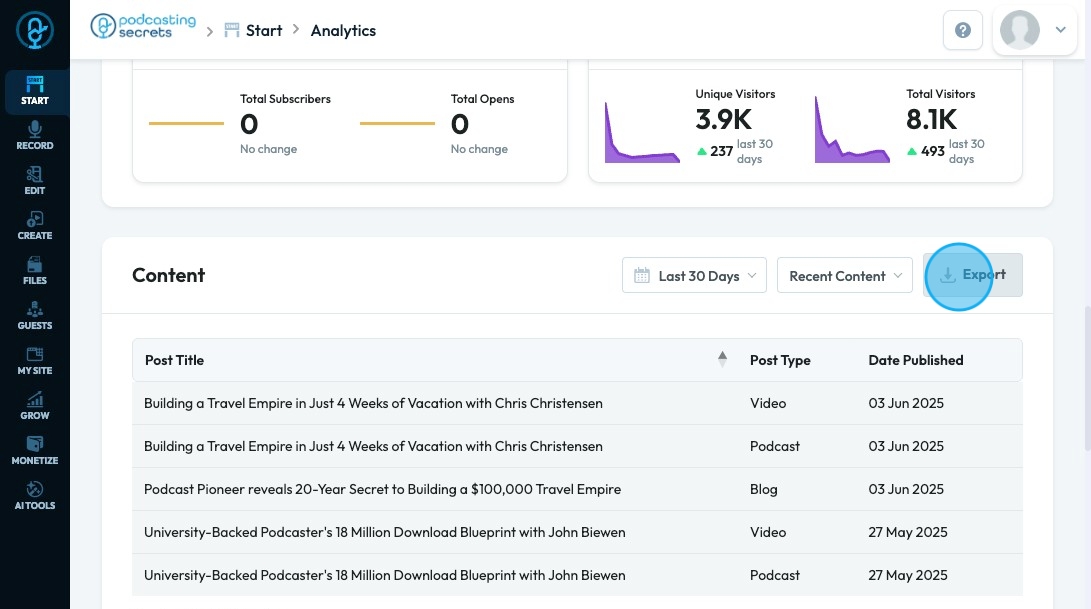
- Recent Content: Displays the content published most recently
- All Content: Displays all content with no particular order
18. Click "Export" to receive an export of the displayed information
- You will receive a downloaded CSV with the Post Title, Post Type and Date Published
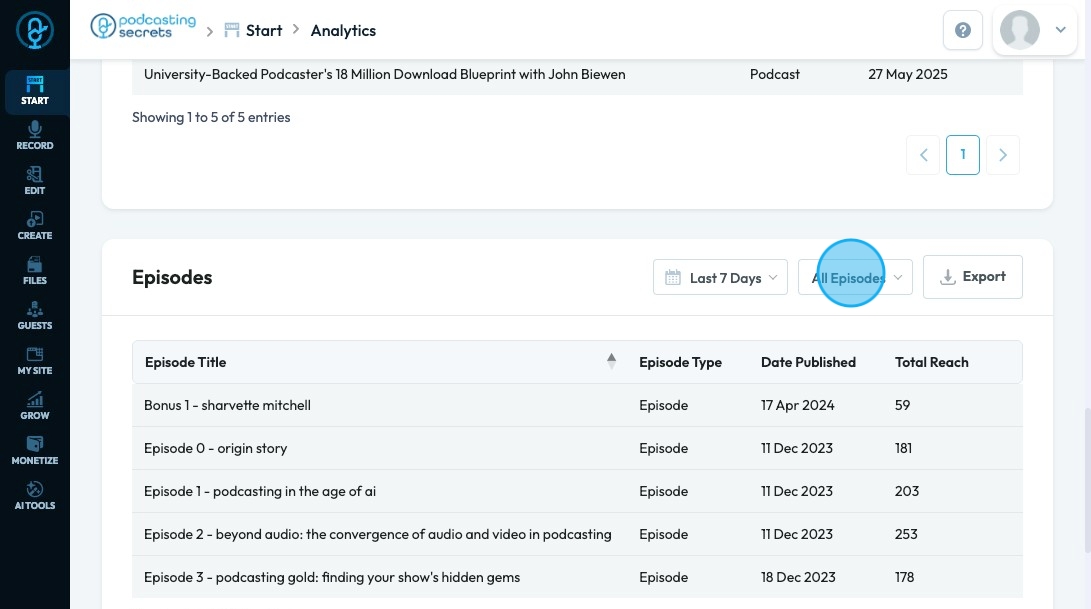
19. Episodes display all of the published episodes with their date published and total reach.
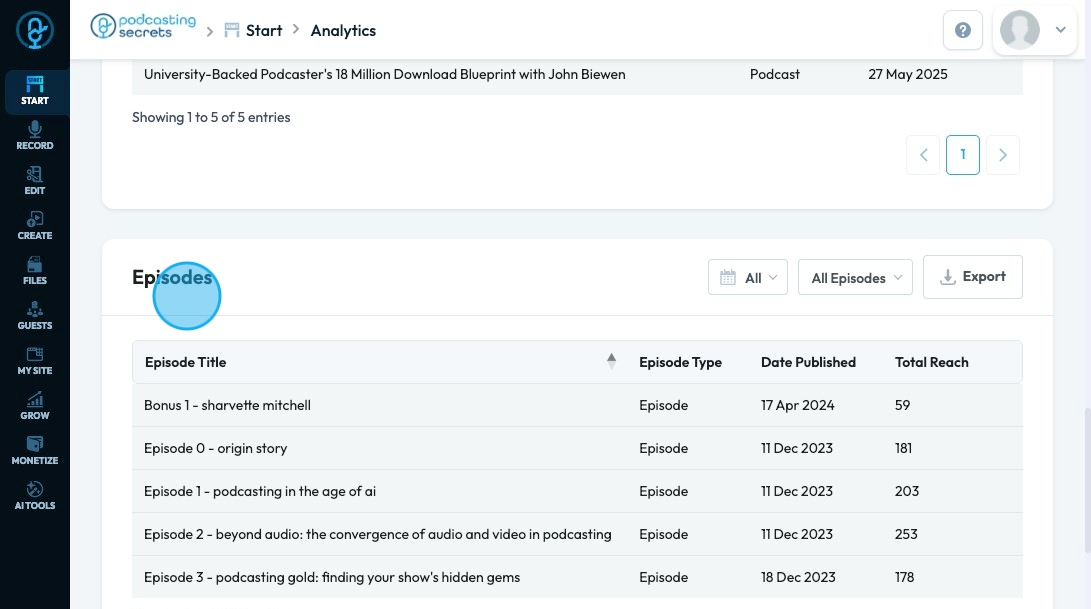
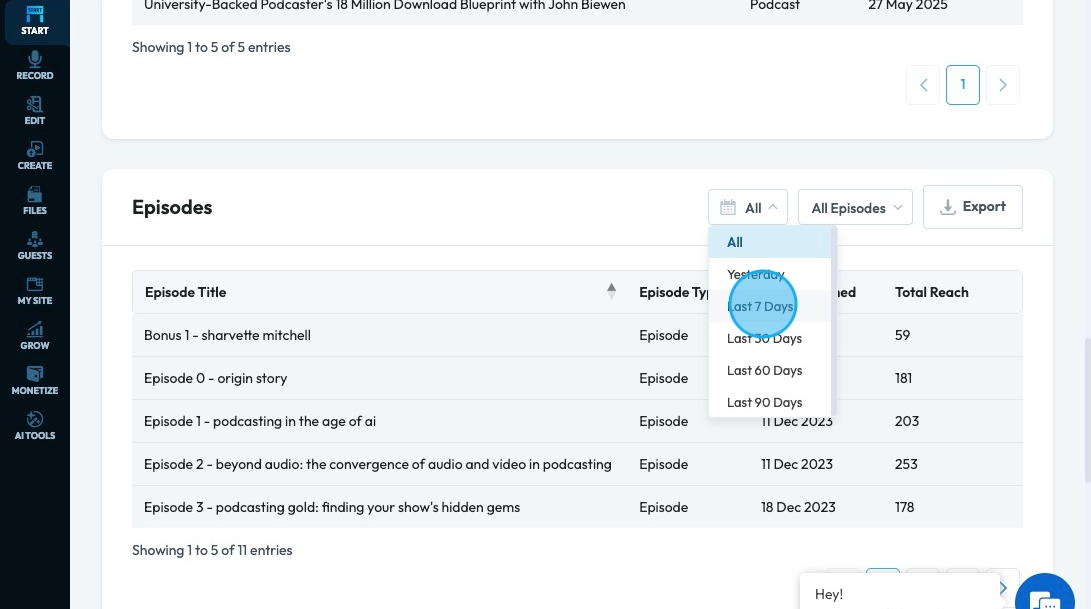
20. Click "All" to filter the episodes by publication date
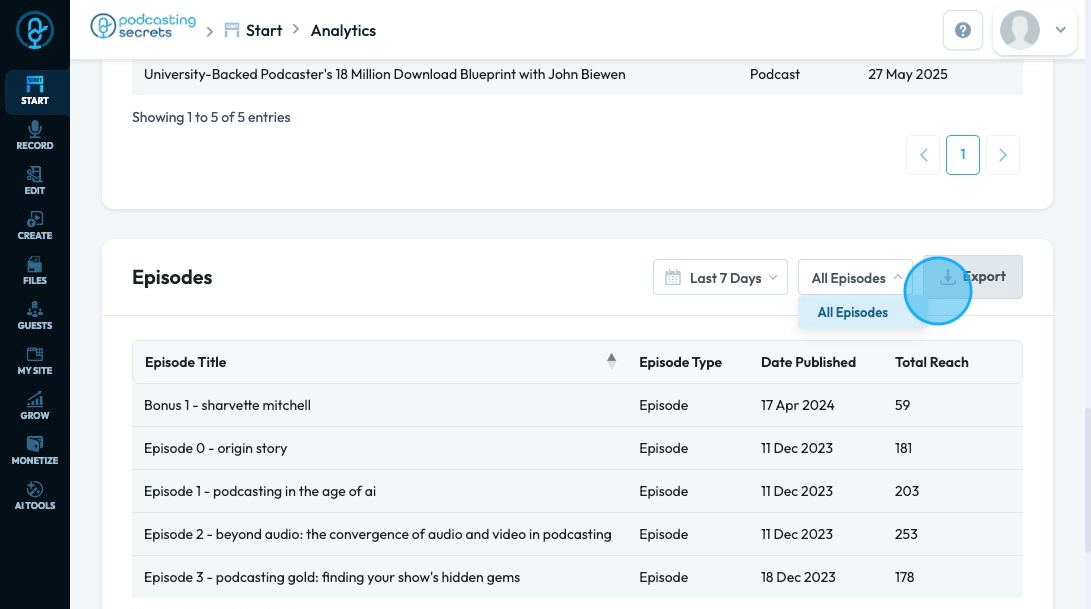
21. "All Episodes" will display all the episodes
22. Click "Export" to receive an export of the displayed information
- You will receive a downloaded CSV with the Post Title, Episode Type, Date Published, and Total Reach
- Note: It is just the information - It is not formatted
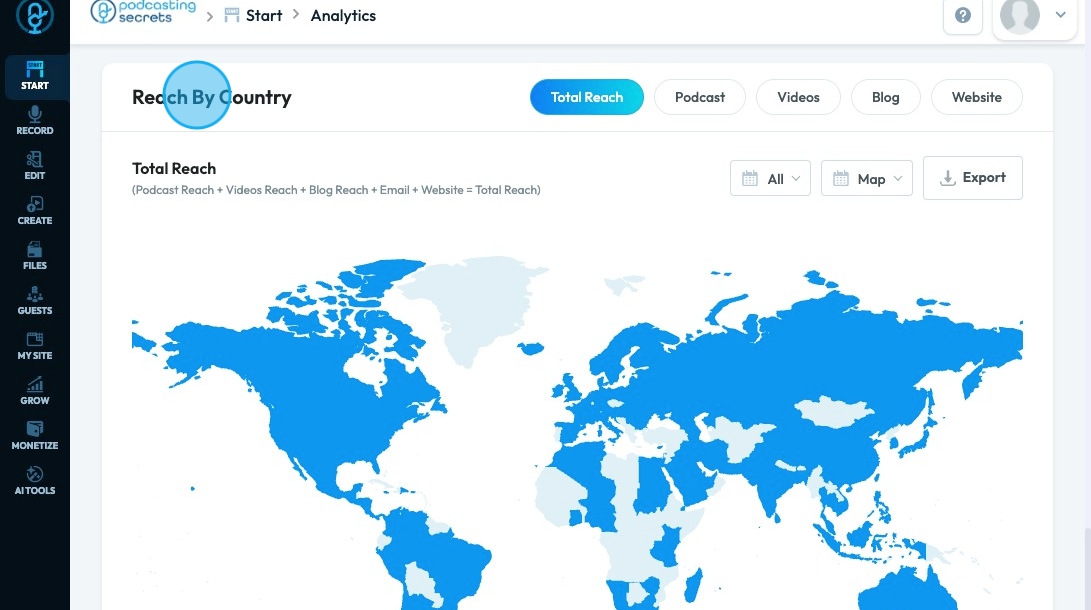
23. "Reach By Country" displays a map of the world. You can select a country and see the reach of each category for that particular country
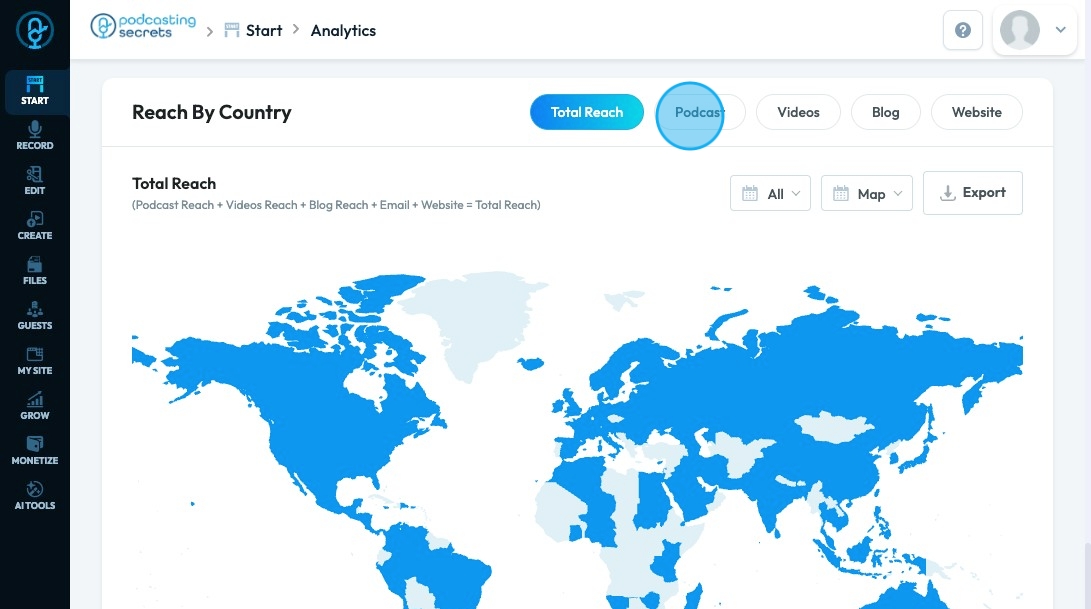
24. Click other categories to see a more detailed view of the reach of platforms in that category
Made with Scribe
Related Articles
Analytics
The podcast analytics dashboard provides a comprehensive overview of your podcast's reach and performance across various channels. Here is a summary of the available reports and what you can derive from them: PodUp Reach Score: Total Reach Score: ...Podcast Episodes
● You can create, edit, manage, schedule, and publish your podcast on your website and various podcast channels. ● Click on “Create Podcast” and fill out the information like the title, summary, images, upload the audio, etc. ● On the left panel, you ...Dashboard
Dashboard Navigation Made by Emma Gwilliam with Scribe This guide is essential for anyone looking to navigate the PodUp dashboard efficiently. It offers a step-by-step approach to accessing vital account information, tracking your podcast reach ...Reputation Management
● Collect and showcase reviews from Google and your podcast site. Enhance your credibility and reputation with potential customers. ● Click on “Add Review” fill in the required information and hit “Save” ● Configure SEO for your site, including tasks ...Integrations
Sign up on top podcast platforms. Link your podcast using our generated RSS feed for automatic content syndication. Ensure you have a published episode on PodUp before connecting. Step 1: Podcast ● Review Your Podcast Info for Required Fields and ...